 We’ve secured funding to power Signal-to-Revenue AI to GTM teams globally. →
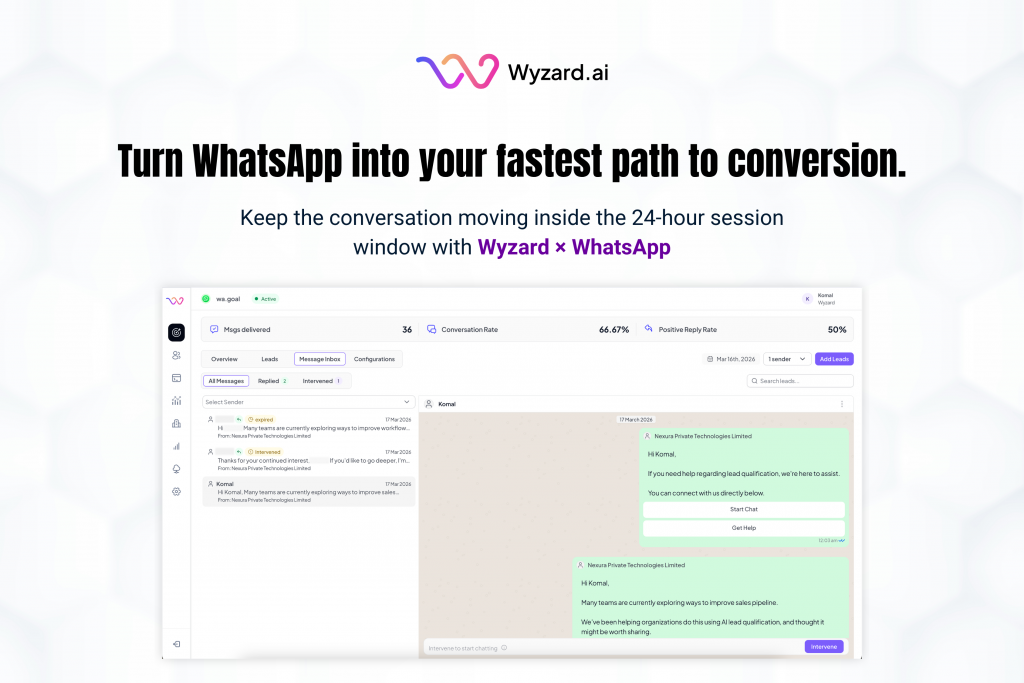
Lead leakage rarely comes from a lack of demand. It shows up after intent, when a prospect is ready ...
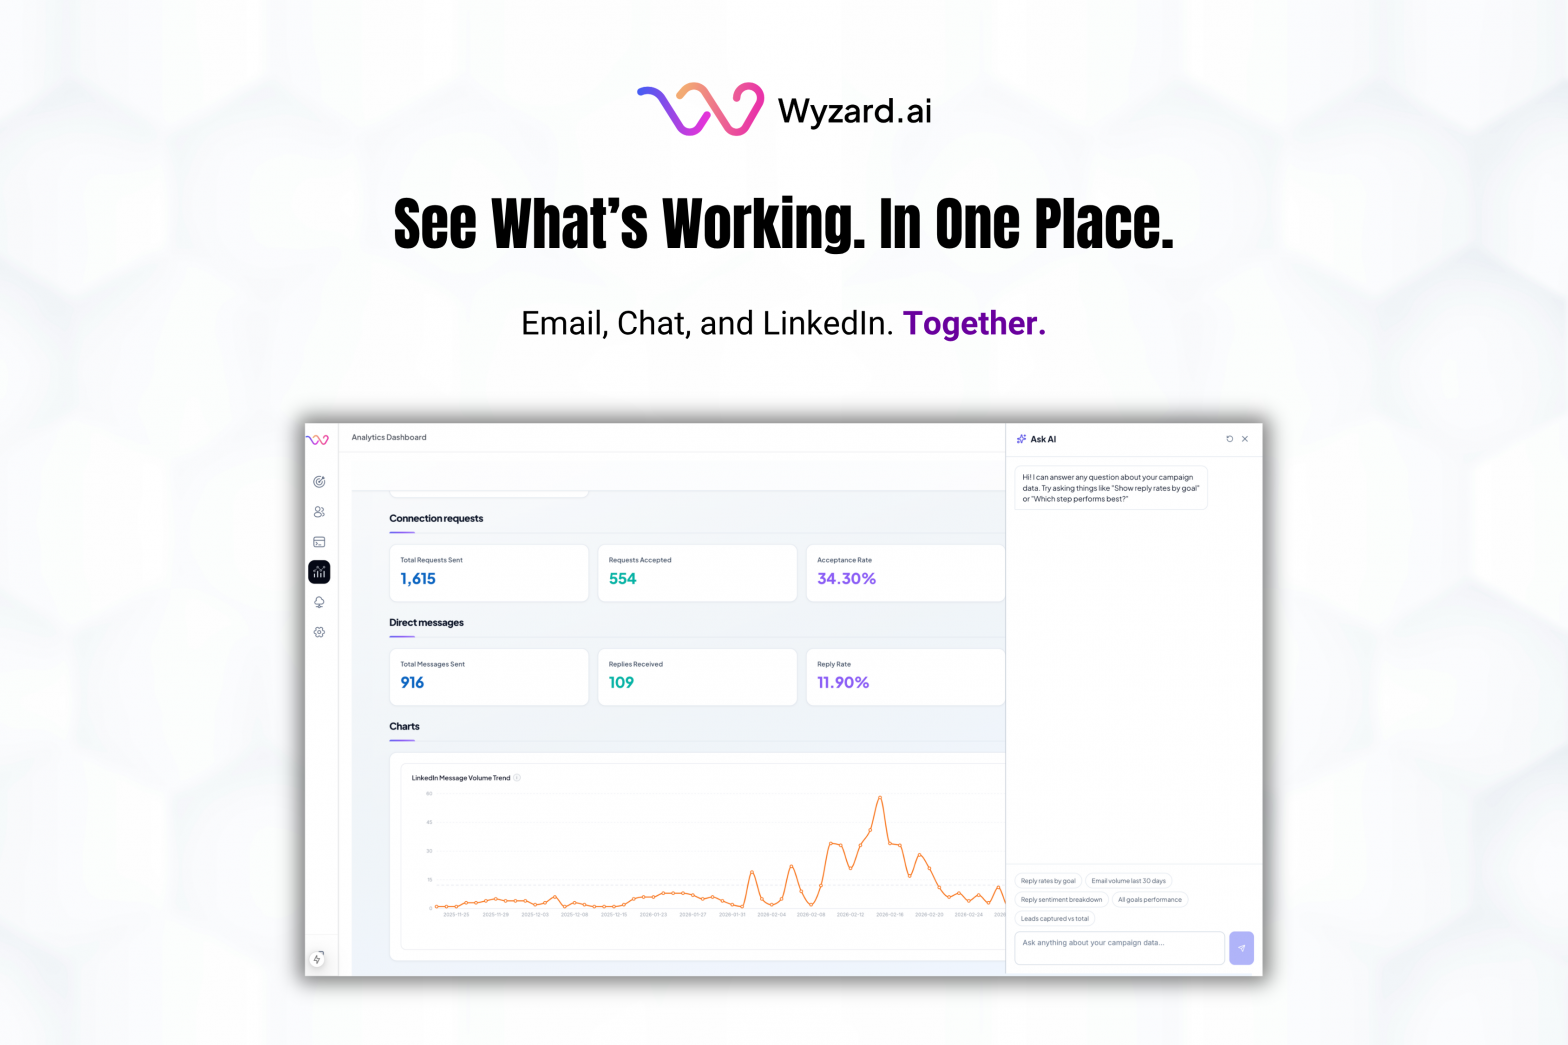
AI Analytics: One Dashboard for Email, Chat, and LinkedIn Performance
Published
Categorized as Uncategorized
Subscribe Now
Analytics should help you decide what to do next. Too often, it turns into busywork. Teams hop across tools, paste screenshots into decks, and wait on one-off reports just to answer simple questions.
That’s why we shipped AI Analytics in Wyzard.ai.
AI Analytics gives you one place to track campaign performance across email, chat, and LinkedIn, using consistent filters and a faster path from “What happened?” to “What do we do next?”
One dashboard with four clear views
AI Analytics is organized into four tabs that match how teams review performance:
- Overall for the full picture
- Email for email performance
- Conversation for chat insights
- LinkedIn for LinkedIn engagement and results
One rule keeps the experience clean: your date range carries across every tab. You can move from Overall to Email to Conversation and still compare apples to apples.
Date ranges that match real reporting
Teams work on different cadences. Some reviews happen daily. Some happen weekly. Leadership asks for “previous month” numbers before QBRs.
AI Analytics supports quick presets like today, last 7 days, last 30 days, and previous month, plus custom ranges. This makes it easier to align the product view with the way your team reports internally.
Export and pin the views you rely on
Two workflows show up in nearly every analytics routine:
Exporting results for decks, reviews, finance, and leadership Tracking the same charts every week.
AI Analytics lets you export the current view to Excel, then share it in the format stakeholders expect. You can pin charts at the bottom of each tab so the dashboard reflects what your team watches most. Pins are saved per account, so your layout stays consistent.
Ask AI for answers, with visibility into the logic
Sometimes you need an answer fast. “Reply rates by goal.” “Volume over time.” “What changed this month?”
Ask AI lets you type questions in plain English and get a response with a chart or table. If you want to verify or reuse the logic, you can open the SQL behind the result. Progress updates show up as the agent works, so you can follow along.
See it live
AI Analytics is rolling out as part of the new experience. Accounts on the rollout can open it from the sidebar under the same analytics entry point used today.
Want a walkthrough on your own data? Book a demo today.
Other blogs
The latest industry news, interviews, technologies, and resources.
March 24, 2026
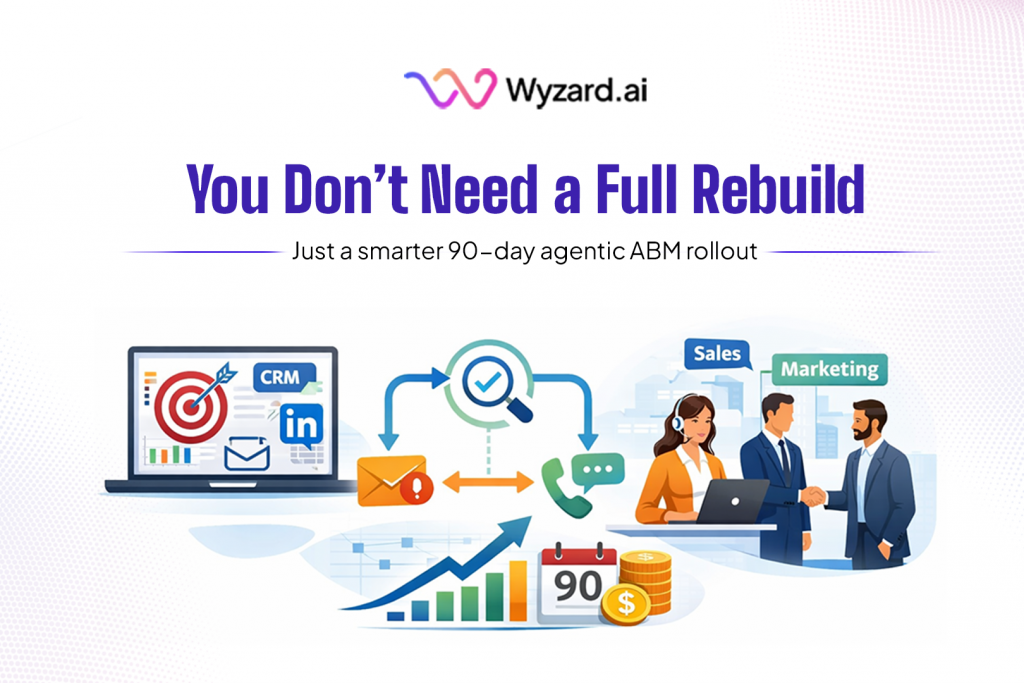
A 90-Day Agentic ABM rollout Plan for Lean Enterprise GTM Teams
If you are a CMO leading a lean GTM team, the issue is rarely demand on its own. The ...
March 20, 2026
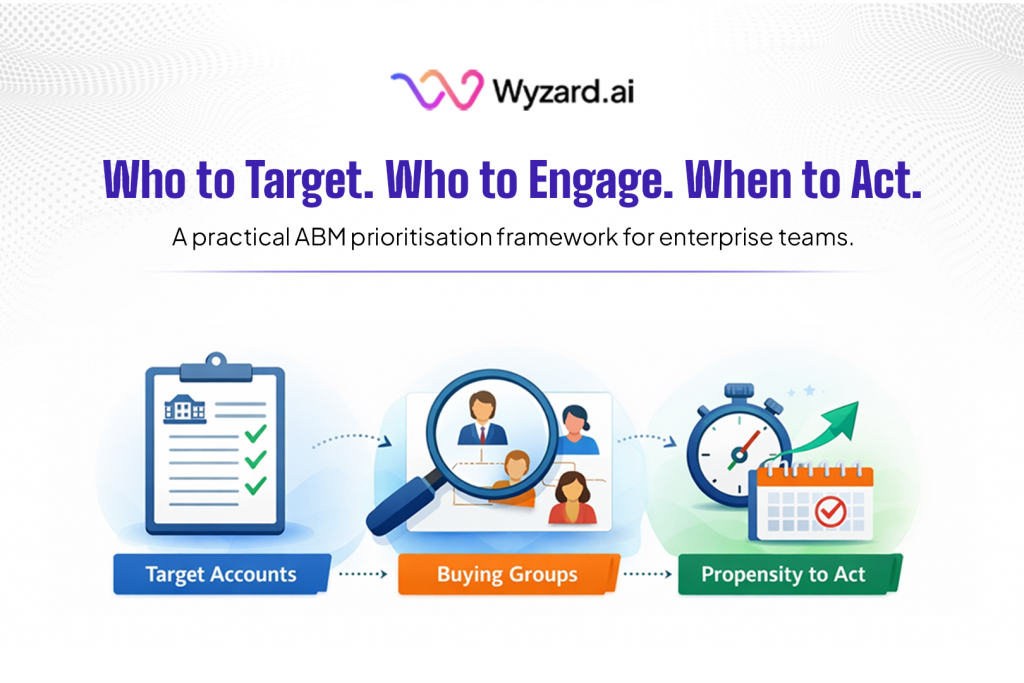
The 3 Decisions Every ABM Program Must Get Right: Account, Buying Group, and Propensity
If you are a CMO, one of the hardest moments in ABM comes when the dashboard is full of ...
