 Meet Us at
 Hi, I am Wyzard, your visionary guide in a world where the buying experience is transforming. The way we ...
9 Best Cloud Monitoring Platforms for Businesses in India
Published
Categorized as SaaS Buying, SaaS Procurement
Subscribe Now
Cloud monitoring is essential for businesses using cloud services. It helps you track and manage your cloud infrastructure, ensuring your digital operations run efficiently.
These monitoring tools collect data from your cloud setup, including websites, apps, and other online services. They organize this information and present it in an easy-to-understand format. This allows you to quickly identify and address issues before they impact your customers or operations.
With cloud monitoring, you can keep an eye on various aspects of your cloud environment:
- Server performance
- Database operations
- Application efficiency
- Website functionality
- Virtual network status
- Overall cloud infrastructure health
- Security and compliance
By using cloud monitoring platforms, you can spot potential problems early, maintain service quality, and make informed decisions about your cloud resources. This proactive approach helps you avoid costly downtime and ensures your business stays competitive.
In this blog, we’ll look into the top cloud monitoring platforms suitable for businesses in India. These tools can help you optimize your cloud performance and keep your operations running smoothly.
How to choose the right cloud monitoring software?
Choosing the right cloud monitoring software is crucial to ensuring that you don’t play catch-up and detect issues as early as possible. Let’s discuss how to pick the best one for your needs.
First, think about what you really need. Do you want to monitor your whole cloud setup or just specific parts? Make a list of what’s important to you.
Now, let’s look at some key features to consider:
- You want a tool that can monitor everything—your servers, databases, apps, and network. It’s like having a control room for your entire cloud operation.
- Make sure the software can work with your current cloud platforms and other systems. You don’t want a tool that doesn’t fit in with your existing setup.
- As your business expands, your monitoring needs will too. Pick a cloud monitoring software that can handle more work without slowing down.
- Look for software that sends alerts when something’s off and creates easy-to-understand reports. This helps you stay on top of things.
- You shouldn’t need a Ph.D. to use the software. A user-friendly interface with clear visuals is a must.
- Choose a tool that helps spot potential threats.
- Some tools can track your cloud spending and suggest ways to save money. That’s always a plus, right?
- Having reliable customer support and an active user community can be a lifesaver when you need help.
Remember, the best tool for you is one that fits your specific needs and budget. Take your time, do some research, and maybe even try out a few options before making your decision. It’s worth the effort to find the right fit for your business.
Best Cloud Monitoring Platforms for Businesses
Here are some of the best cloud monitoring solutions that help you identify service bottlenecks quickly so you can respond before they become costly problems.
1. Datadog
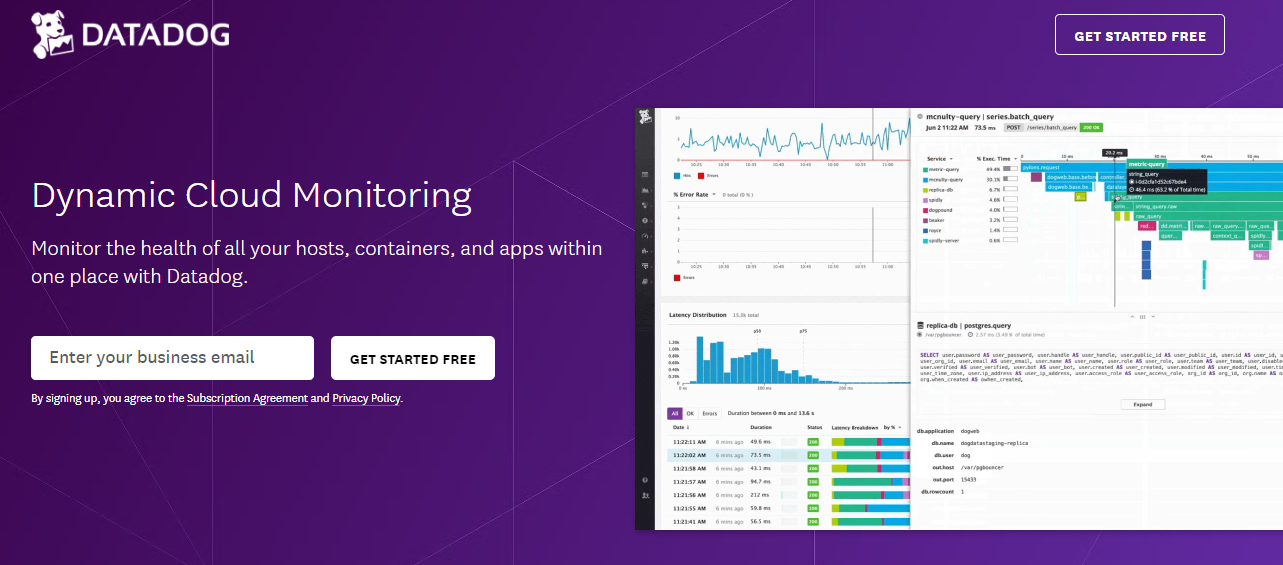
Datadog is a comprehensive cloud monitoring platform designed to simplify the collection, visualization, and analysis of data from various cloud services.
Its intuitive interface and pre-configured integrations with popular platforms like AWS, GCP, Alibaba Cloud, and Azure make it easy for users to consolidate data.
Datadog supports over 400 platforms and services, including Slack and PagerDuty, and provides robust API access for custom applications. This makes it a versatile tool for monitoring the performance of cloud applications, infrastructure, and logs.
Features
- Offers a wide range of connectors and support for distributed tracing, helping users track application performance.
- Allows users to collect, centralize, and analyze logs from multiple sources.
- Provides tools for monitoring real users and synthetic transactions to ensure optimal performance.
- Enables monitoring of network performance and host-level metrics.
- Users can create and share custom dashboards using metrics and logs.
- Uses machine learning to set intelligent alerts and reduce noise.
- Facilitates team communication with integrated collaboration tools.
- Allows interaction with data, tags, and dashboards programmatically.
Pros
- Comprehensive observability system.
- Monitors hosts, containers, processes, and serverless.
- Rich logs integration.
- Powerful and flexible data analysis tools.
Cons
- Complex installation process for advanced metrics.
- NetFlow data not automatically included.
2. Dynatrace
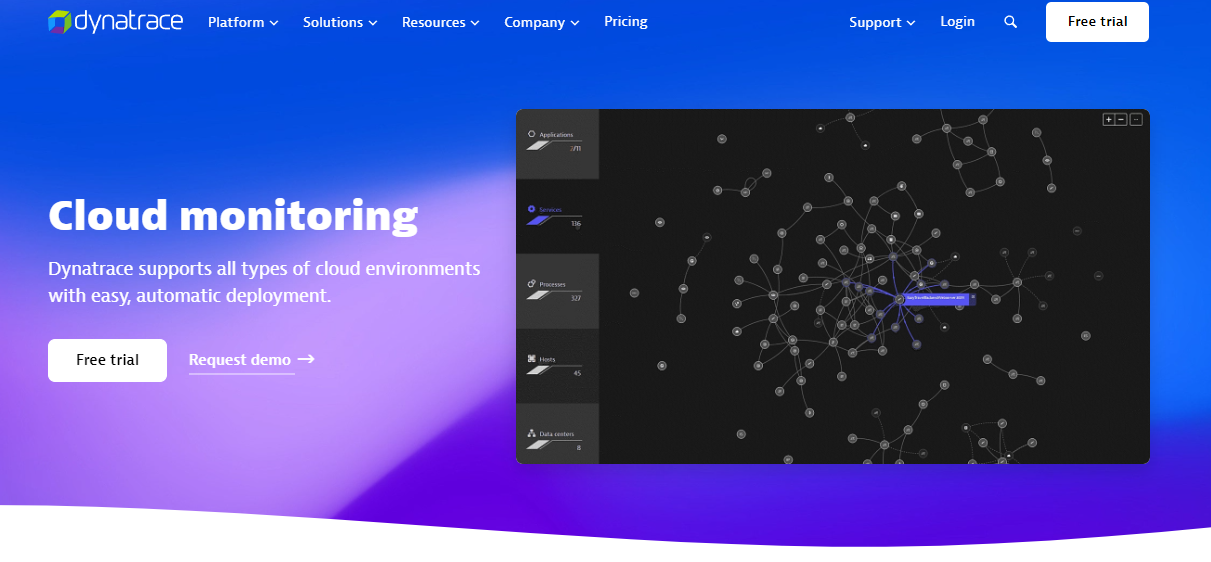
Dynatrace provides a full-stack observability solution with an easy-to-use interface for monitoring cloud applications, infrastructure, and logs.
Its single operating agent simplifies deployment and management, making monitoring more straightforward and enjoyable.
Available as both a service and on-premise solution, Dynatrace meets various monitoring needs, including application performance, user activity, and infrastructure monitoring.
Features
- Offers comprehensive dashboards and integrations for frequently used tools, enabling detailed cloud application performance monitoring.
- Supports tracing at the code level to identify performance issues within applications.
- Provides automated detection of common system and application log types.
- Monitors both real users and synthetic transactions to ensure performance and reliability.
- Includes tools for memory dumps, exceptions, CPU analysis, and top database and web queries.
- Integrates with Docker, Kubernetes, and OpenShift for container monitoring.
- Compatible with major cloud platforms like AWS, Azure, and GCP.
Pros
- Straightforward agent installation with UI assistance.
- Extensive integration library for monitoring cloud services and applications.
- Intuitive stack view from application to database.
- Dedicated problem-solving features for efficient troubleshooting.
Cons
- Initial complexity may be overwhelming for new users.
- Serverless offering is less comprehensive than other solutions.
3. Nagios XI
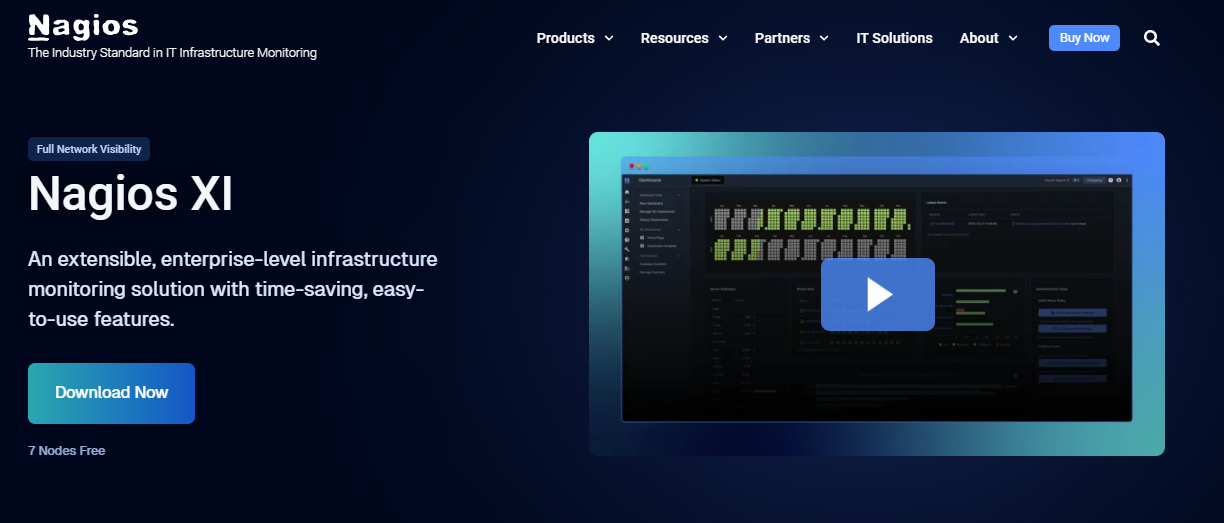
Nagios XI is a powerful monitoring tool designed for Linux-based services, switches, applications, and servers.
It seamlessly integrates with Nagios Core 6, the open-source monitoring platform, supporting thousands of community plugins.
Nagios XI helps you analyze network traffic across your entire infrastructure, allowing you to detect problematic traffic sources, potential threats, and gain insights into your network’s health.
It also provides detailed analysis of bandwidth usage based on IP or source.
Features
- Continuous monitoring of system performance.
- Real-time alerts for any anomalies.
- Recommendations to enhance performance.
- Monitors multiple networks simultaneously.
- Supports various systems and platforms.
- Establishes and monitors performance baselines.
- Visual representation of data for better insights.
- Analyzes network paths for potential issues.
- Customizable dashboards for data visualization.
- Immediate notifications for any issues.
- Manages multiple servers efficiently.
- Monitors systems in real-time.
Pros
- 3rd party integrations via open API.
- Flexible and configurable long-term storage.
- Small footprint, efficient for thousands of checks and reports.
- Responsive support with diverse resolution methods.
Cons
- Limited dashlets for new views.
- No support for MS Azure and limited Amazon cloud monitoring.
4. Solar Winds
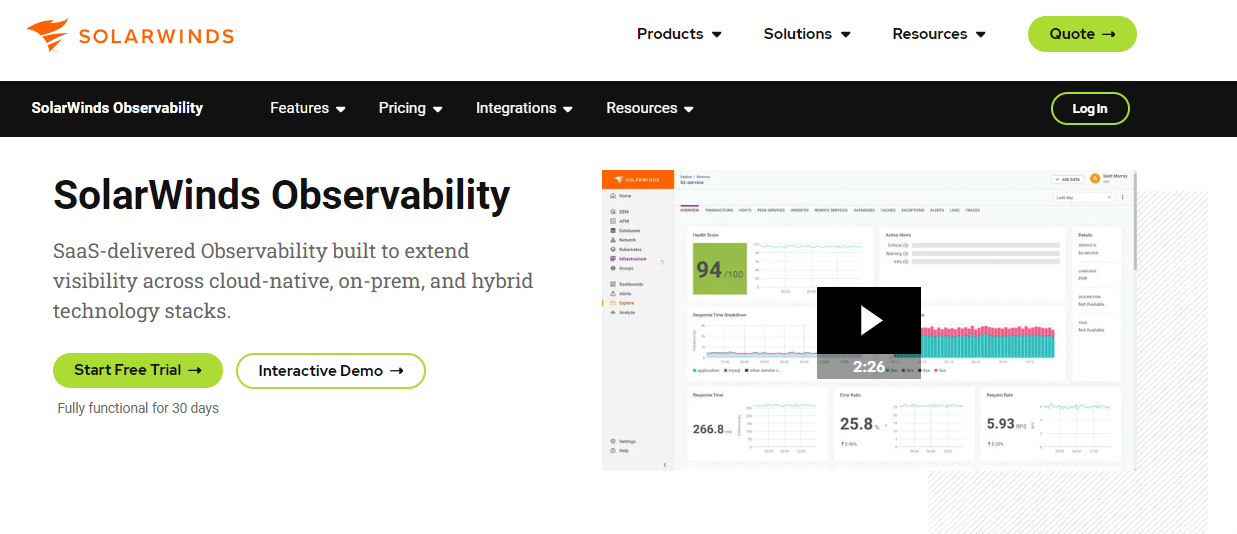
SolarWinds Network Performance Monitor is an intuitive and user-friendly tool that can be quickly installed and deployed. It automatically detects network devices and provides a customizable web-based interface for managing network performance. SolarWinds allows you to create custom topologies for your entire network and develop intelligent, dependency-aware alerts.
Features
- Scans and discovers wired and wireless devices.
- Plans for future needs across various OEM vendors.
- Identifies network performance issues.
- Analyzes critical data points with an easy-to-use interface.
- Provides simple and complex trigger options.
- Monitors Cisco ASA networks, ACLs, VPNs, and interfaces.
- Keeps track of firewall rules.
- Automatically maps and views network topology.
Pros
- Supports auto-discovery for real-time network topology maps.
- Excellent alerting features.
- SNMP monitoring and packet analysis for flexibility.
- Customizable dashboard with drag-and-drop widgets.
- Pre-configured templates, reports, and dashboard views.
Cons
- Overwhelming for non-technical users.
- Limited integration with third-party products.
5. New Relic
New Relic is a modern cloud monitoring tool widely used for its ability to monitor complex and dynamic cloud infrastructures. It provides real-time insights into cloud applications and servers, monitoring page load times, error rates, sluggish transactions, and a list of operating servers. New Relic also assists with database performance by executing SQL queries.
Features
- Tracks and reports error rates.
- Monitors page load times.
- Detects and reports sluggish transactions.
- Provides a list of running servers.
- Executes SQL queries to monitor database performance.
- Allows users to set personalized alerts.
- Enables creation of tailored dashboards.
Pros
- Adaptable and easy to install.
- Superb information granularity.
- Integrates with multiple tools for custom alert metrics.
Cons
- Metrics can be confusing initially.
- Mobile application needs improvement.
6. Zabbix
Zabbix is a robust open-source cloud monitoring tool known for its highly configurable setups, making it a great choice for customized monitoring solutions.
First launched in 2001, Zabbix can use agents to collect data from cloud-based VMs and integrates with Amazon CloudWatch for direct metric collection.
Despite its capabilities, Zabbix can be tricky to set up, especially for cloud environments, and its scalability is limited to 1,000 nodes.
However, it remains an excellent choice for small to medium-sized cloud setups requiring detailed customization.
Features
- Collect metrics from any source.
- Customize metric collection methods.
- Push and pull data collection.
- High-intensity data collection with 1-second intervals.
- Log file monitoring and filtering.
- Native high-performance agent.
- Data buffering for communication issues.
- Flexible scheduling intervals.
- Agent-less monitoring using any protocol.
- Synthetic monitoring for real-life transactions.
Pros
- Live network activity graphs from switches and firewalls.
- SNMP data display from hardware servers.
- Complex alerting for various OS and hardware types.
- Alerts for device or link downtime.
- Bandwidth and resource usage monitoring.
Cons
- Complex user interface.
- Steep learning curve.
- Extensive but unclear documentation for basic tasks.
7. HoneyComb
Honeycomb is a cutting-edge cloud monitoring tool designed for modern cloud-native applications, providing unique insights into system performance and behavior.
Its innovative approach to observability offers a comprehensive platform for understanding and troubleshooting complex systems.
Honeycomb excels in providing high-resolution telemetry data, allowing users to delve deeply into specific events and anomalies.
By capturing and analyzing rich data sets, Honeycomb enables easy identification of patterns, correlations, and root causes of issues.
Features
- Granular data analysis.
- Dynamic sampling capabilities.
- Collaborative debugging tools.
- High-resolution telemetry data.
- Detailed event and anomaly analysis.
- Comprehensive root cause analysis.
- Customizable dashboards.
- Third-party integrations.
- Incident and timeline management.
- Server logs and performance metrics.
Pros
- Granular data analysis for system behavior insights.
- Dynamic sampling for relevant data capture.
- Facilitates collaborative debugging.
- High-resolution telemetry for detailed event analysis.
- Comprehensive root cause analysis capabilities.
Cons
- Steep learning curve for advanced features.
- Potentially high costs for budget-conscious organizations.
8. Coralogix
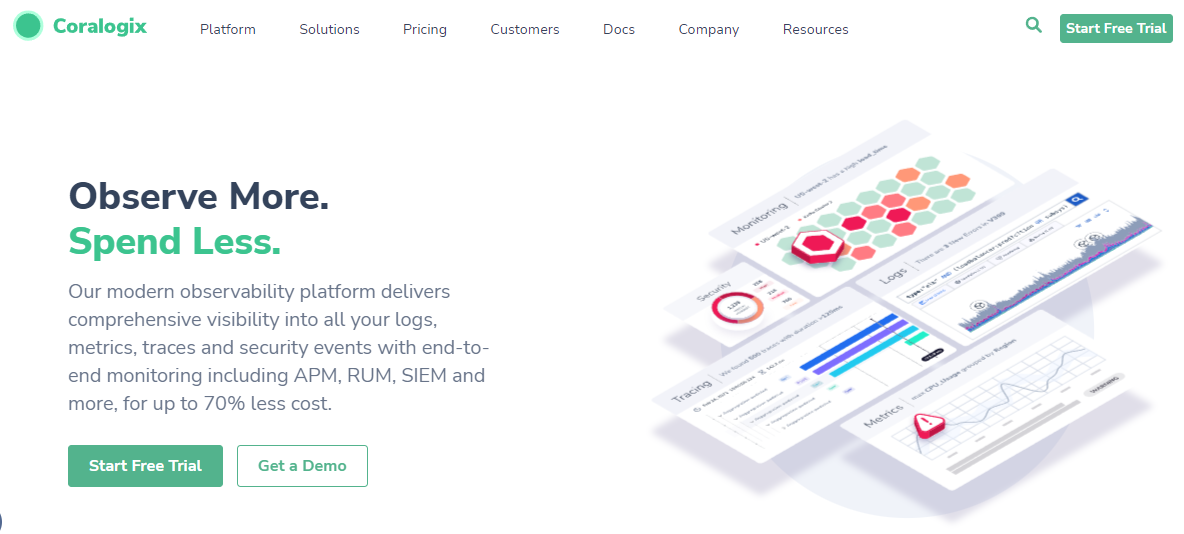
Coralogix is a comprehensive platform designed to help organizations manage and analyze their log data efficiently.
It offers robust solutions for log management, simplifying the processes of gathering, storing, and processing log data. This helps in identifying issues, tracking performance, and enhancing system health.
Coralogix stands out with its ‘Unified Threat Intelligence’ feature, which integrates with global threat intelligence feeds curated by security experts, enabling the detection of malicious activities without complex API integrations. This feature enhances log data with potential threat indicators in real-time, allowing easy search, visualization, and alert setup for security threats.
Features
- Data Collection and Centralized Storage with unique Streama© technology.
- Automatic data transformation and parsing for structured telemetry data.
- Enrich data with business, operations, or security information.
- Record new metric time series for leaner and quicker metrics.
- Extract specific insights using Lucene, SQL, or DataPrime query language.
- Set up alerts and notifications based on specific conditions or thresholds.
- Advanced monitoring with Events2Metrics functionality and APM.
- Create unlimited custom dashboards or use pre-built ones.
- Compliance and security features with encryption and access controls.
Pros
- User-friendly with a customizable dashboard.
- 24/7 support with quick response and resolution times.
- Pricing based on GB ingested, no extra costs for features.
- Archiving and remote query for low-cost storage.
- Monitoring helps identify and stop unauthorized access attempts.
- Built-in cost optimization for significant savings.
Cons
- Interface could be more user-friendly.
- Issues with Terraform providers and documentation.
- Integration of main modules into a single subscription would be helpful.
9. AppDynamics
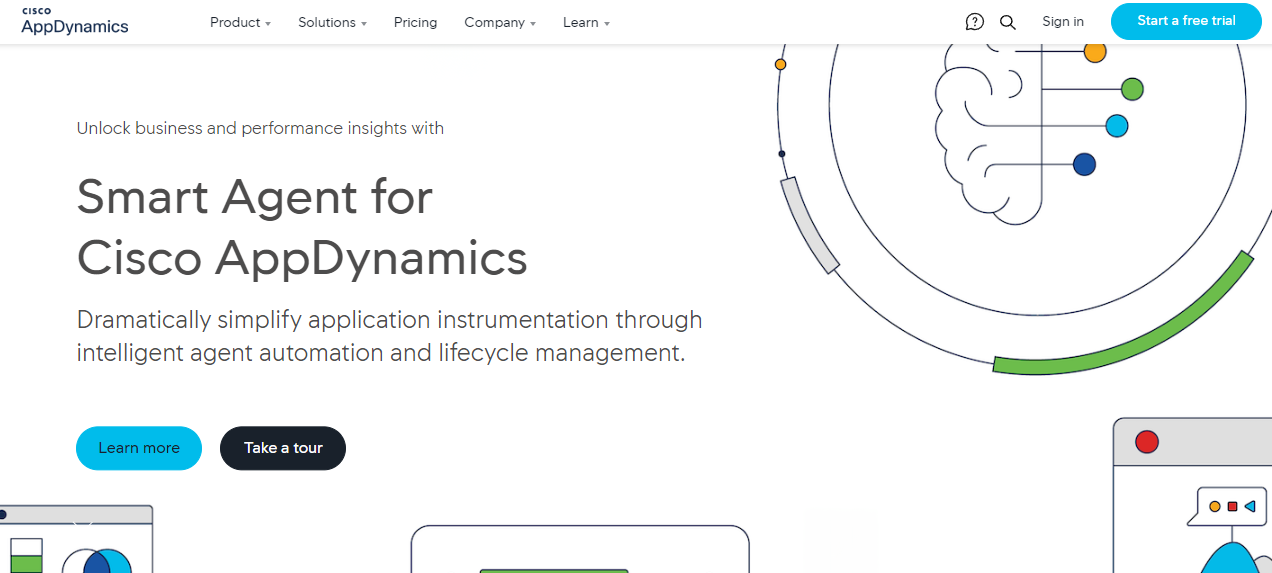
AppDynamics offers comprehensive cloud-based network monitoring solutions available as both software-as-a-service and on-premise.
It allows businesses to link application performance indicators with infrastructure data, alerts, and business-level KPIs.
This platform provides insights into the entire stack powering services, from top-level transactions to code-level data.
AppDynamics is ideal for large enterprises, offering a range of monitoring capabilities and detailed environment information that supports both business leaders and technical teams.
Features
- End-user monitoring with real-time, synthetic, and IoT monitoring on smartphones and browsers.
- Cloud infrastructure monitoring for network components, databases, and servers.
- Business-oriented dashboards to visualize and analyze performance and business data.
- Anomaly identification and root cause investigation using Machine Learning.
- Email templating and period digest features for alerting.
Pros
- Detailed environment information, including JVM application launch settings.
- Advanced language features like automated leak detection for JVM-based stack.
- Visibility into connections between system components and business activities.
- Up to code-level visibility and automatic diagnostics for server and application metrics.
- Comprehensive performance monitoring for large-scale applications.
Cons
- Prohibitively costly and complex pricing, focused on major corporations.
- Manual agent download and startup required during installation.
- Limited fundamental data in the free plan, such as system CPU and memory consumption.
Choose the most suitable cloud monitoring platform with Wyzard!
When it comes to cloud monitoring, every business has unique needs and requirements. For example, a small startup might prioritize ease of use and cost-effectiveness, opting for a platform like Coralogix that offers excellent support and cost optimization. On the other hand, a large enterprise might need the robust and comprehensive monitoring capabilities of AppDynamics to handle complex environments and detailed performance analysis.
As you can see, each cloud monitoring platform mentioned above comes with its own set of pros and cons. Moreover, the pricing structures of these platforms vary significantly, adding another layer of complexity to your decision-making process. This is where Wyzard comes in.
Wyzard understands your specific business needs and, based on these requirements and your budget, recommends the most suitable cloud monitoring platform for you. The best part is, Wyzard negotiates on your behalf to help you procure the chosen platform at the best possible price.
Once you have the ideal platform in place, Wyzard continues to support you by managing your account and optimizing usage to save on cloud spending. This ensures that you get the maximum value from your investment without any unnecessary expenses.
Book a demo with Wyzard today and discover how we can help you choose, procure, and manage the perfect cloud monitoring solution for your business!
Other blogs
The latest industry news, interviews, technologies, and resources.
March 17, 2025
How LLM-Based AI Agents are Simplifying the Software Buying Process for Businesses
Let’s talk about something that’s becoming a game-changer in our daily lives: AI agents. Think of them as your ...
March 11, 2025
Is Your Business Ready for CRM Software? Find Out Now!
Running a small business can feel like juggling a million things at once. You are busy with customers, ensuring ...

Subscribe
Today!
Error: Contact form not found.
Subscribe to learn about new product features, the latest in technology, solutions, and updates.